技術情報
- 2021年12月07日
- 技術情報
Some Web Security tools which developers should use
Today I would like to share about some web security tools that should be used by developers. When we develop a software, we must also consider the aspects of security. So, in some situations, not only have to write secure codes but reverse testing is also needed. Let’s take a look at some web security tools as follows.
1. Zed Attack Proxy (ZAP)
Developed by OWASP (Open Web Application Security Project), ZAP or Zed Attack Proxy is a multi-platform, open-source web application security testing tool. ZAP is used for finding a number of security vulnerabilities in a web app during the development as well as the testing phase.
2. Wapiti
Wapiti is a open source project. Wapiti performs black box testing to check web applications for security vulnerabilities. As it is a command-line application, it is important to have a knowledge of various commands used by Wapiti. You can find all the Wapiti instructions on the official documentation. For checking whether a script is vulnerable or not, Wapiti injects payloads. This tool provides support for both GET and POST HTTP attack methods.
Vulnerabilities exposed by Wapiti are:
- Command Execution detection
- CRLF injection
- Database injection
- File disclosure
- Shellshock or Bash bug
- SSRF (Server Side Request Forgery)
- Weak .htaccess configurations that can be bypassed
- XSS injection
- XXE injection
3. Sqlmap
SQLMap is entirely free to use that allow automating the process of detecting and utilizing SQL injection vulnerability in a website’s database. This tool supports 6 types of SQL injection techniques:
- Boolean-based blind
- Error-based
- Out-of-band
- Stacked queries
- Time-based blind
- UNION query
4. Skipfish
Skipfish is a web application security tool that crawls your website and then checks each page for various security threats and provides a final security report. It is highly optimized for HTTP handling and utilizing minimum CPU.
5. Burp Suite
Burp Suite is a Java-based web penetration testing framework. Its various tools work seamlessly together to support the entire testing process, from initial mapping and analysis of an application’s attack surface, through to finding and exploiting security vulnerabilities. The tool intercepts HTTP/S requests and acts as a middle-man between the user and web pages. The paid version provides a more agile automated testing tool with integrations with other frameworks such as Jenkins.
6. Nikto
The Nikto web server scanner is a security tool that will test a website for thousands of possible security issues including dangerous files, mis-configured services, vulnerable scripts and other issues. It is open source and structured with plugins that extend the capabilities.
Hope you enjoy that.
By Asahi
waithaw at 2021年12月07日 10:00:00
- 2021年12月06日
- 技術情報
PHP 8.1 is here
The PHP team has released PHP 8.1. Let’s see a bit of some main features they have added.
Improvements
There are many improvements as follow.
- Enumerations
- Readonly properties
- Pure Intersection Types
- never return type
- First-class Callable Syntax
- New array_is_list function
- and many more
We will walk through some feature more details.
Enumerations
PHP 8.1 supports Enumerations (Enums) natively, providing an API for defining and working with Enums:
enum Data
{
    case Draft;
    case Published;
    case Archived;
}
function acceptStatus(Data $data) {...}
Read-only Properties
Read-only properties cannot be changed after they are initialized. You can be confident that your data classes are consistent. PHP 8.1 can reduce boilerplate by defining public properties the author does not intend to change.
class Sample
{
    public readonly Data $data;

    public function __construct(Data $data)
    {
        $this->data = $data;
    }
}
First-class Callable Syntax
You can make make a closure from a callable by calling it and passing "...“
function sum(int $a, int $b) {
    // ...
}

$sum = sum(...);
$sum(1, 5);
$sum(5, 3);
and there are still more interesting features to look more detail. Please check the official documentation for more detail.
Yuuma
yuuma at 2021年12月06日 10:00:00
- 2021年12月03日
- 技術情報
JS(Chart.js)-内側と外側にdata labelsを表示する方法
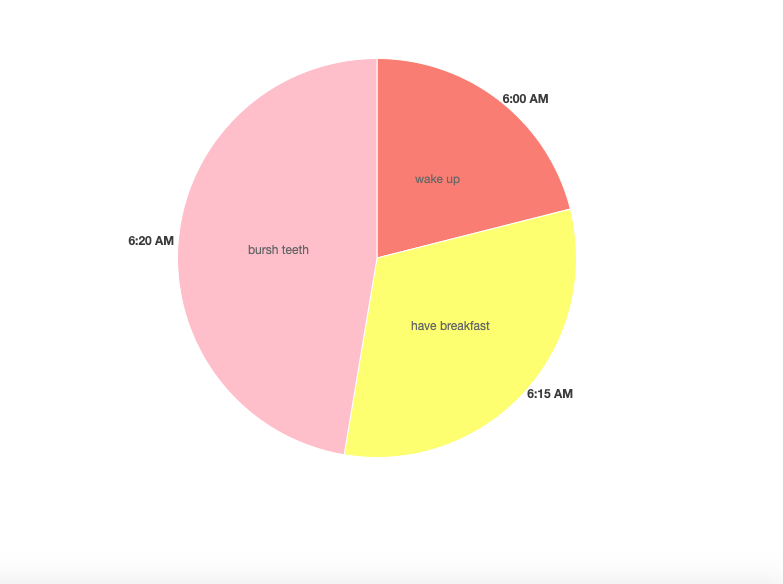
今回は、Chart.js DataLabelsを使って、canvasに円グラフを描く方法をご紹介します。
まずは、htmlファイルを作成し、その中に4つのスクリプトファイルをインポートしています。
    <script src="https://cdn.jsdelivr.net/npm/chart.js@3.0.0/dist/chart.min.js"></script>
    <script src="https://cdn.jsdelivr.net/npm/chart.js@2.8.0"></script>
    <script src="https://cdn.jsdelivr.net/npm/chartjs-plugin-datalabels@2.0.0"></script>
    <script src="https://unpkg.com/chart.js-plugin-labels-dv@3.0.5/dist/chartjs-plugin-labels.min.js"></script>
<canvas id="my-chart"></canvas>以上のcanvasにに円グラフを作成します。円グラフを作成するには、このようなdataが含まれている必要があります。
        var data = {
                labels: ["6:00 AM", "6:15 AM", "6:20 AM"],

                datasets: [
                    {
                        labels: ["wake up", "have breakfast", "bursh teeth"],
                        backgroundColor: ["#FA8072","#FFFF66","#FFC0CB"],
                        data: [40, 60, 90],
                        borderWidth: 1,

                    }
                ]
};また、typeをpieにする必要もあります。もう一つ、datalabelsを表示するために、グラフにプラグイン名をインポートします。
var myChart = new Chart(ctx, {
            type: 'pie',
            data: data,
           plugins: [ChartDataLabels],
});
ラベルを外に見せるために、このようなセットを挿入します。
                    labels: {
                        render: function(d) {
                            return `${d.label}`;
                        },
                        position: 'outside',
                    },
円グラフの中で、ラベルを表示するには次のようにします。
datalabels: {

                        formatter: function(value, context) {
                            return context.dataset.labels[context.dataIndex];
                        },
                  },
その結果が上部に表示されています。
この記事を楽しんでもらえたら嬉しいです。
By Ami
asahi at 2021年12月03日 10:00:00
- 2021年12月02日
- 技術情報
Laravel フォーム入力内容の復元
入力フォームを設置する場合に編集モードでは、DBに登録されている値を初期値として表示、
またバリデーションエラーになった場合はフォームに入力した値を復元したい場合があります。
そのような場合は、Laravelではold関数を使用することで簡単に対応できますので
その方法をシェアしたいと思います。
old関数について
{{ old(‘name’) }}
old関数の第2引数にデフォルト値が設定できます。DBに登録されている値を
初期値として表示したい場合に便利です。
{{ old(‘name’, ‘デフォルト値’) }}
テキストボックスの使用例
最もシンプルなテキストボックスでの使用例です。
<input type="text" name="name" id="name" value="{{ old('name', $recdata['name']) }}">
ラジオボタンの使用例
ラジオボタンは複数の選択肢の中からひとつだけ選択できる入力フォーマットです。
選択しているボタンの属性に「checked」をつけ加えるためold関数の値から条件分岐を設定しています。
@foreach ($list as $item)
<span><input type="radio" name="gender" id="gender{{$item->code}}" value="{{$item->code}}"
{{ old('gender', $recdata['gender'])==$item->code ? 'checked':'' }}>
<label for="gender{{$item->code}}" class="radio">{{$item->value}}</label></span>
@endforeach
プルダウンメニューの使用例
プルダウンメニューは複数の選択肢の中からひとつだけ選択できる入力フォーマットです。
選択しているリストアイテムの属性に「selected」をつけ加えるためold関数の値から条件分岐を設定しています。
<select name="pref" id="pref">
<option value="">都道府県を選択</option>
@foreach ($prefs as $pref)
  <option value="{{$pref->code}}"
  {{ old('pref', $recdata['pref'])==$pref->code ? 'selected':'' }}>
  {{$pref->value}}</option>
@endforeach
</select>
チェックボックスの使用例
チェックボックスは複数の選択肢の中から複数選択可能な入力フォーマットです。
複数選択可能なため配列になっています。
選択しているチェックボックスの属性に「checked」をつけ加えるためold関数の値から条件分岐を設定しています。
@foreach ($list as $item)
<span><input type="checkbox" name="fav_player[]" id="fav_player{{$item->code}}" value="{{$item->code}}"
@if (is_array(old("fav_player", $recdata['fav_player'])) && in_array($item->code, old('fav_player', $recdata['fav_player']))) checked @endif>
<label for="fav_player{{$item->code}}" class="checkbox">{{$item->value}}</label></span>
@endforeach
木曜日担当:nishida
nishida at 2021年12月02日 10:00:00
- 2021年11月29日
- 技術情報
Deleting .env file back from Git
Sometimes , we accidentally pushed a file with some username , password or secret tokens etc. It has a variety security concerns for your project and this should be removed back from Git.
Git ignore
First thing you need to do is to add the file you don’t want to push to git at .gitignore file. Add it in .gitignore , commit and push it.
# Secret file
.env
But this will not change any effects to .env as the file is already pushed before and .gitignore doesn’t untracked the already committed changes
Deleting the file
So we have to remove the specific file , .env in our case from the git remote repo entirely. We can use the following command.
git rm -r --cached .envIf we push the changes , the .env file will be remove from the remote repository
Git History
However, one more thing is left which is git histories. We can check the .env file contents also in git histories. So we need to remove the specific git history as well to hide the .env contents.
To remove the file altogether, we can use like following.
git filter-branch --index-filter "git rm -rf --cached --ignore-unmatch .env" HEADWhen you push this time, you have to use –force option.
git push --forceIf we look at our history, we can still see the commits that include .env file but the content is empty.
That’s all for now.
Yuuma
yuuma at 2021年11月29日 10:00:00
 大人が楽しめるヒーリング絵本河童のカパと静かな森
 パワースポット 日本三大神滝布引の滝
 佐藤・広幸ドイツ魂
 Himeji Castle姫路城
 ボイドタイムお知らせアプリVoid Time 〜月を無視できない〜
 撮った写真をカレンダーに撮りカレ