Diagram as Code
- 2022年8月08日
- 技術情報
Diagrams allow you to draw cloud system architectures in Python code. It was created to prototype a new system architecture design without the use of design tools. You can also describe or visualize your existing system architecture.
I once talked about Mermaid which is a JavaScript-based graphing and charting tool that takes Markdown-inspired text definitions and dynamically creates charts in your browser. You can read more below.
Similarly, Diagram allows us to draw system architect design using just code. Diagram currently supports all major providers including AWS, Azure, GCP, Kubernetes, Alibaba Cloud, Oracle Cloud and more.
Let’s take a quick example how this works.
from diagrams import Diagram
from diagrams.aws.compute import EC2
from diagrams.aws.database import RDS
from diagrams.aws.network import ELB

with Diagram("Grouped Workers", show=False, direction="TB"):
    ELB("lb") >> [EC2("worker1"),
                  EC2("worker2"),
                  EC2("worker3"),
                  EC2("worker4"),
                  EC2("worker5")] >> RDS("events")
This will result as below.
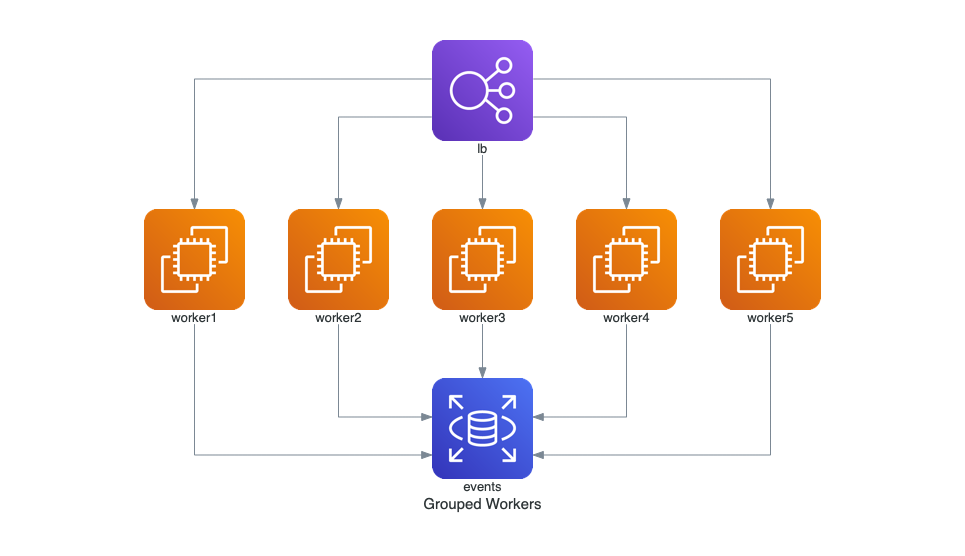
You can see we can build amazing architecture design just by using some python code. Please check more detail at their Github and quick examples here.
Yuuma
yuuma at 2022年08月08日 10:00:00
 大人が楽しめるヒーリング絵本河童のカパと静かな森
 パワースポット 日本三大神滝布引の滝
 佐藤・広幸ドイツ魂
 Himeji Castle姫路城
 ボイドタイムお知らせアプリVoid Time 〜月を無視できない〜
 撮った写真をカレンダーに撮りカレ