Mermaid diagrams in Github markdown
- 2022年2月28日
- 技術情報
The only way to include images and figures in your Github Markdown file is to embed images or svgs. If you want to keep your diagrams updated, want to make changes everytime and create diagrams easily, you should take a look at Mermaid.
Mermaid is a JavaScript-based graphing and charting tool that takes Markdown-inspired text definitions and dynamically creates charts in your browser.
It supports a variety of common diagram types for software projects like flowcharts, UML, Git charts, user flow diagrams, Gantt charts.
For example, its syntax is like below.
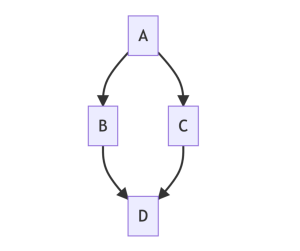
```mermaid
  graph TD;
      A-->B;
      A-->C;
      B-->D;
      C-->D;
```
Credit: Github
The above code snippet will output as below.
The result is a fast, easy-to-edit vector-based diagram where you need it in your document. Mermaid is becoming more and more popular among developers and have a rich community of contributors.
When we write a block of code marked as mermaid, it generates an iframe that takes the raw syntax of Mermaid and passes it to Mermaid.js, converting that code into a diagram in the local browser.
As a conculsion , it’s awesome and convient for developers who want to add diagrams on their github markdown. Thanks to the Knut Sveidqvist, creator of mermaid and you can also checkout the mermaid website here.
Yuuma
yuuma at 2022年02月28日 10:00:00
 大人が楽しめるヒーリング絵本河童のカパと静かな森
 パワースポット 日本三大神滝布引の滝
 佐藤・広幸ドイツ魂
 Himeji Castle姫路城
 ボイドタイムお知らせアプリVoid Time 〜月を無視できない〜
 撮った写真をカレンダーに撮りカレ